🚀 Cache Me If You Can
A comprehensive, production-ready microservice project designed to teach Redis caching patterns through hands-on experience. Features FastAPI backend, PostgreSQL database, Redis cache, and an interactive Astro frontend with real-time performance metrics.
Perfect for learning cache-aside patterns, Docker orchestration, and microservice architecture in a realistic development environment.
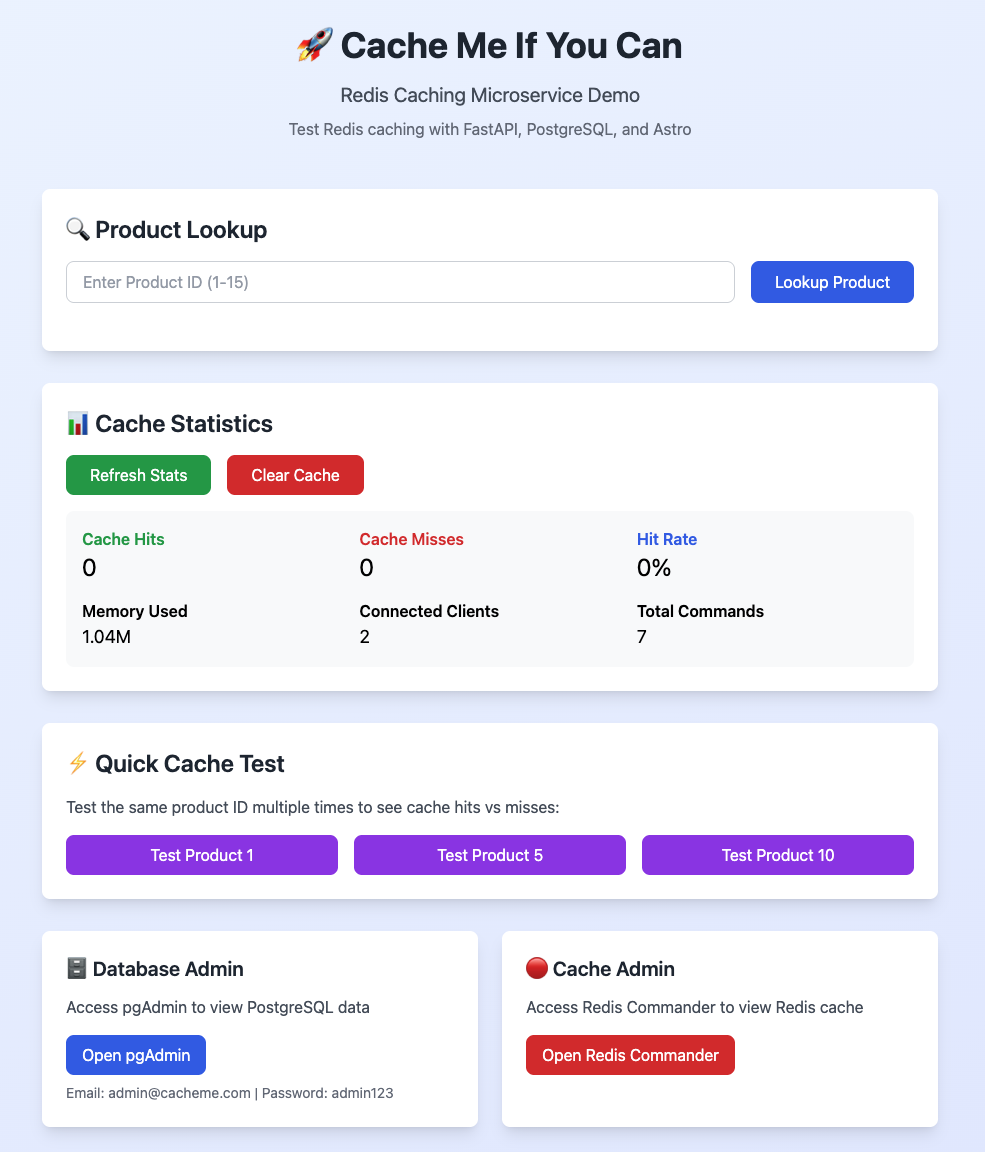 The main testing interface with real-time performance metrics and cache statistics
🔧 Tech Stack
| Component | Tool/Framework | Version | Purpose |
|---|---|---|---|
| Backend | FastAPI + Uvicorn | Python 3.12.3 | RESTful API service |
| Database | PostgreSQL | 15.6 | Primary data store |
| Cache | Redis | 7.2.5 | High-performance caching layer |
| Frontend | Astro + Tailwind | Node 20.12.0 | Interactive testing interface |
| DB Admin | pgAdmin | 9.4 | PostgreSQL management UI |
| Cache Admin | Redis Commander | Latest | Redis visualization & management |
| Orchestration | Docker Compose | Latest | Service coordination |
🏗️ Architecture
┌──────────────────┐   GET /products/{id}   ┌──────────────────┐
│                  │──────────────────────→│                  │
│  Astro Frontend  │                        │  FastAPI Backend │
│ (localhost:3000) │←──────────────────────│ (localhost:8000) │
│                  │  4. JSON + Metrics     │                  │
└──────────────────┘                        └─────────┬────────┘
                                                      │
                                                      │ 1. Check Redis
                                                      │
                                            ┌─────────▼─────────┐
                                            │                   │
                                            │    Redis Cache    │
                                            │ (localhost:6379)  │
                                            └─────────┬─────────┘
                                                      │
                                          ┌───────────┴───────────┐
                                          │                       │
                                     ✅ Cache Hit           ❌ Cache Miss
                                          │                       │
                               (2ms response)                     │
                                                                  ▼
                                                     ┌─────────────────────┐
                                                     │                     │
                                                     │ PostgreSQL Database │
                                                     │  (localhost:5432)   │
                                                     └──────────┬──────────┘
                                                                │
                                                                │ 2. Query DB
                                                                │ (50-200ms)
                                                                │
                                                     3. Cache result & return
🚀 Quick Start
Prerequisites: Docker (20.10+), Docker Compose (2.0+), ports 3000, 8000, 5432, 6379, 5050, 5540 available, 2GB+ RAM
1. Launch Services
# Start all services (first run will build images)
docker compose up -d --build

# Check all services are healthy
docker compose ps
2. Access Applications
| Service | URL | Credentials | Purpose |
|---|---|---|---|
| Frontend | http://localhost:3000 | None | Main testing interface |
| API Docs | http://localhost:8000/docs | None | Interactive API documentation |
| pgAdmin | http://localhost:5050 | admin@cacheme.com / admin123 |
Database management |
| Redis Commander | http://localhost:5540 | None | Cache visualization |
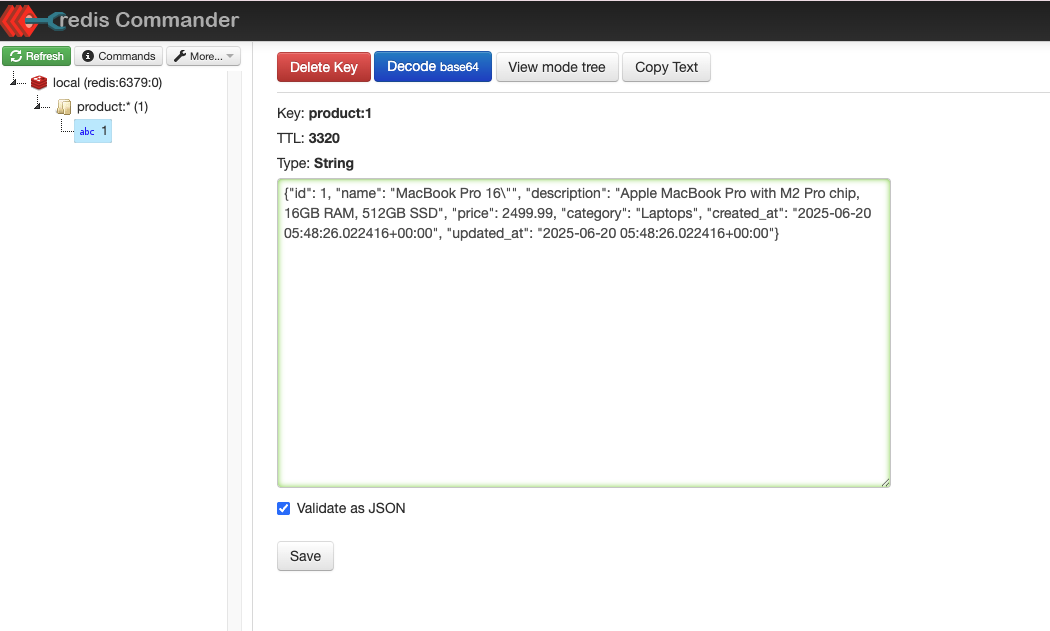 Redis Commander interface showing cached product keys, data types, and TTL information
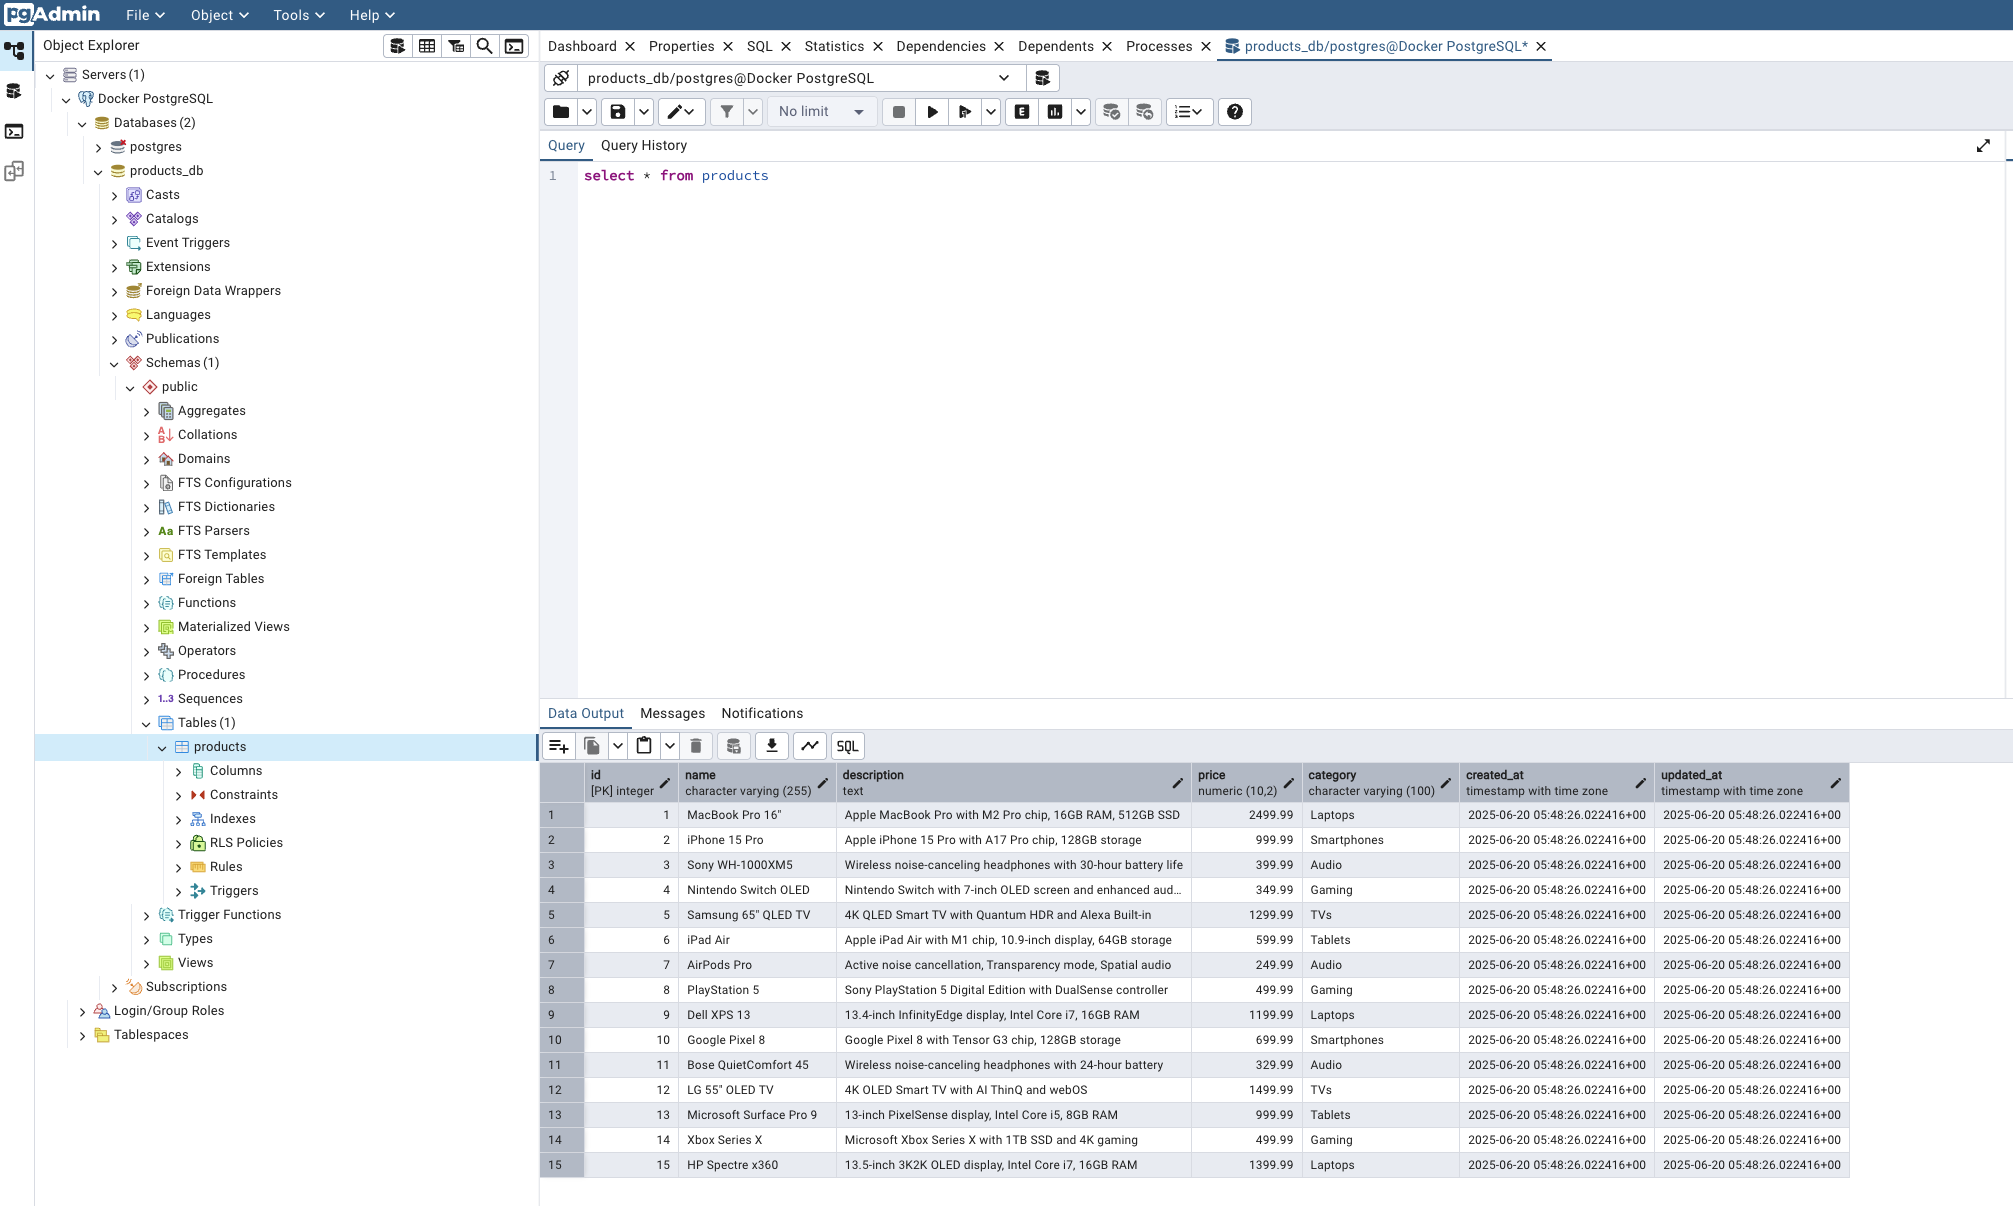 pgAdmin automatically configured with PostgreSQL connection and sample product data
🎉 Everything is pre-configured! PostgreSQL initializes with 15 sample products, pgAdmin auto-connects to the database, and Redis Commander connects to the cache.
🧠 Understanding Redis Caching
What is Redis? Redis (Remote Dictionary Server) is an in-memory data structure store that serves as a database, cache, and message broker. Used by Twitter, GitHub, Instagram, and Snapchat.
🚨 The Problem Redis Solves
- Traditional Issue: Every user request hits the database directly
- Result: Slow response times, high server costs, poor user experience
- Redis Solution: Cache frequently accessed data in memory for instant retrieval
Real-World Use Cases:
- E-commerce: Product catalogs, user sessions, shopping carts
- Social Media: User profiles, news feeds, trending content
- Gaming: Leaderboards, player stats, game state
- Financial: Stock prices, exchange rates, account balances
- Content Delivery: Web pages, API responses, search results
Key Redis Advantages:
- 🚀 Speed: In-memory storage = microsecond response times
- 🗂️ Data Structures: Strings, hashes, lists, sets, sorted sets, bitmaps
- ⏰ Smart Expiration: Automatic data cleanup with TTL
- 🔄 Persistence: Optional disk backup for data safety
- 📊 Monitoring: Built-in statistics and performance metrics
- 🔧 Atomic Operations: Thread-safe operations for concurrent access
Cache-Aside Pattern (Our Implementation):
- Application Request → User wants product data
- Check Cache First → Query Redis for cached product
- Cache Miss → If not found, query PostgreSQL database
- Cache Population → Store database result in Redis with TTL
- Cache Hit → Next request gets data instantly from Redis
- Performance Win → 10-100x faster response for subsequent requests
Business Impact:
- Performance: Sub-millisecond response times
- Scalability: Handle 10x more users with same infrastructure
- Cost Savings: Reduce database server requirements by 50-80%
- User Experience: Faster page loads = higher conversion rates
- Reliability: Less database load = fewer timeouts and errors
⚡ Performance & Features
💡 Local Environment Note: Response times vary by system, but you’ll always observe dramatic performance differences between cache hits and database queries.
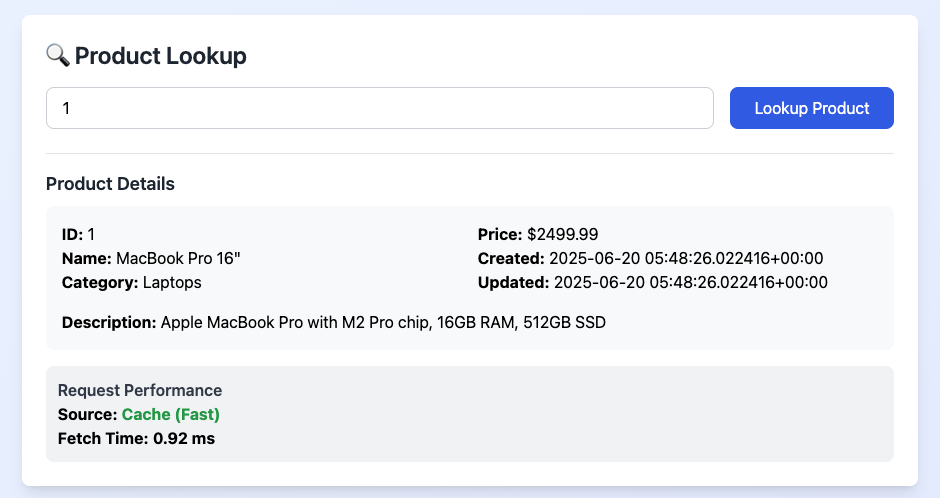
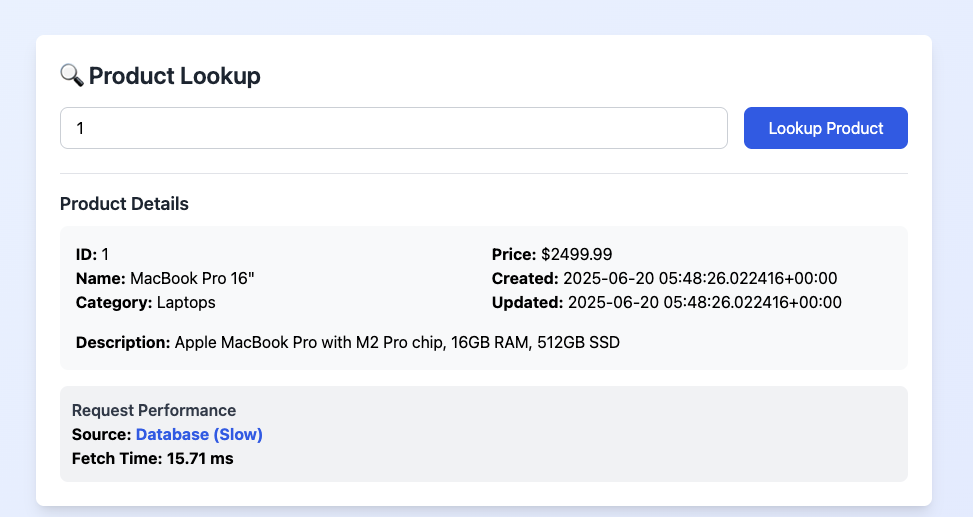 Redis cache hits vs PostgreSQL database queries - 5-50x performance improvement
Performance Expectations:
| Scenario | Response Time | Source | Speed Improvement |
|---|---|---|---|
| Cache Hit | ~2-15ms | Redis | 5-50x faster |
| Cache Miss | ~20-300ms | PostgreSQL | Baseline |
Interactive Features:
- Product Lookup: Test individual products with real-time metrics
- Quick Test Buttons: One-click testing for products 1, 5, and 10
- Performance Tracking: Visual indicators for cache vs database responses
- Cache Management: Clear all cached data with one button
- Real-Time Metrics: Response time tracking, source identification, live statistics
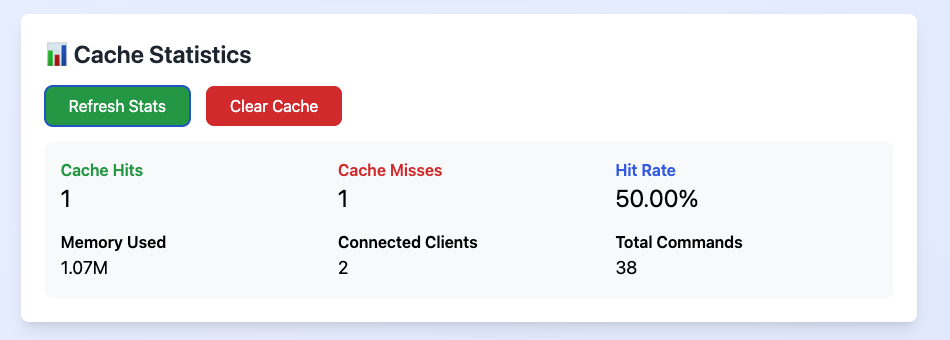 Live Redis cache statistics dashboard
Key Performance Indicators:
- Cache Hits/Misses: Success vs fallback to database
- Hit Rate:
(Hits / (Hits + Misses)) × 100- Target 80%+ in production - Memory Usage: Current Redis memory consumption
- Connected Clients: Active connections (typically 2: backend + Redis Commander)
- Total Commands: All Redis operations since startup
🔧 API Reference
Core Endpoints:
GET    /products/{id}     # Get product with caching & metrics
GET    /products          # List all products (paginated)
GET    /cache/stats       # Redis cache statistics
DELETE /cache/clear       # Clear all cached data
GET    /health            # Service health check
Product Response Format:
{
  "id": 1,
  "name": "Wireless Headphones",
  "category": "Electronics",
  "price": 79.99,
  "description": "High-quality wireless headphones...",
  "created_at": "2024-01-01T00:00:00",
  "updated_at": "2024-01-01T00:00:00",
  "source": "cache",           // "cache" or "database"
  "fetch_time_ms": 2.45        // Processing time in milliseconds
}
Cache Statistics Response:
{
  "cache_stats": {
    "keyspace_hits": 42,
    "keyspace_misses": 8,
    "used_memory_human": "1.2M",
    "connected_clients": 2,
    "total_commands_processed": 156
  }
}
🛠️ Management & Troubleshooting
Volume Management:
# List all project volumes
docker volume ls | grep cache-me

# Volume purposes:
# cache-me-postgres-data        → Database files
# cache-me-redis-data          → Cache persistence
# cache-me-pgadmin-data        → Admin configuration
# cache-me-frontend-node-modules → Dependencies

# Complete reset (removes all data)
docker compose down -v
Common Issues & Solutions:
🔴 Services won’t start
# Check port conflicts
netstat -tulpn | grep -E ':(3000|8000|5432|6379|5050|5540)'
# View service logs
docker compose logs <service-name>
🔴 Database connection issues
# Reset database volume
docker compose down
docker volume rm cache-me-postgres-data
docker compose up -d
🔴 Cache not working
# Check Redis connectivity
docker compose exec backend redis-cli -h redis ping
# View backend logs
docker compose logs -f backend
🔴 pgAdmin server not auto-configured
# Reset pgAdmin configuration
docker compose down
docker volume rm cache-me-pgadmin-data
docker compose up -d
Performance Issues:
- Slow responses: Check Docker resource allocation (increase RAM/CPU)
- High memory usage: Clear cache via UI or restart Redis container
- Connection timeouts: Ensure all services are healthy:
docker compose ps
Monitoring:
# Follow all service logs
docker compose logs -f

# Monitor specific service
docker compose logs -f backend

# Check service health
docker compose ps

# Test API health
curl http://localhost:8000/health